There are outputs and the processes that produce those outputs. This article shows a way to measure qualitative variation via a simple experiement. In a business, if there are many processes that produce the same output — that can be a silent killer for a business.
Consider an inventory management system, where associates on the factory floor are to use a scanner-based tool to adjust physical inventory in the cycle counting process. Ideally, there ought to be a tool that guides and helps the cycle counter do his or her job correctly. But, some, if not all, warehouse management systems aren’t built to actually help the associate on the factory floor. The result: variation in processes, leading to potentially the same output, but ridden with errors.
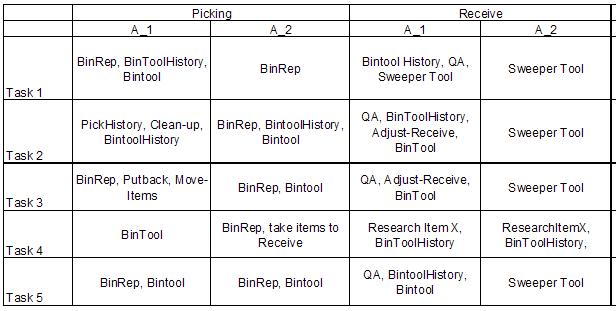
I once led a project that looked at how cycle counters adjusted inventory for a middle-market consumer packaged goods company. Our team conducted a Task-Based Usability Test, where we chose a random sample of associates, chose common tasks that Cycle Counters encounter everyday, and see what tools and steps they would take to accomplish that task. The result: A Qualitative and very revealing view of the variation in the approaches of the associates. Below is an example of what that test might look like (because of confidentiality, the image below is not the real output of that study, but an example for this article):

On the left, we see the various common tasks that Cycle Counters see everyday in their jobs. On the top column, we see the areas of responsibilities, followed by the associate ID, since this was a scrubbed, or anonymous test. The content is their answers based on the tasks.
Notice that the tools used qualitatively vary — in other words, there is clearly variation in the tools used and in how people adjust inventory for this consumer packaged goods client. What does this mean?
For one, variation in any process can lead — no, — it does lead to defects, errors, and customer dissatisfaction. For another, this firm introduced complexity into their system by providing so many tools that seemingly all do the same thing. Later, we found out that there was wide overlap in the tools — their functions and goals. The wide selection of tools for the associates to choose from creates confusion, variation, and is unnecessary complexity. The culprit: The firm allowed complexity to be introduced to the system.
Lesson Learned
Complexity is a silent killer for a business. Prior to our study, little did this firm know, but this complexity problem alone — which was introduced by the firm itself — was causing the firm several million dollars in inventory write-off’s per year. The root cause was a proliferation of internal tools that was too complex and encouraged variation in how Cycle Counters adjusted inventory.
Is there uncontrolled proliferation of products, features, and processes in your business?


No responses / comments so far.