This is part 1 of a 3 part series. The other parts can be found here: Part 1, Part 2, Part 3.
Previously in Part 1, we discussed the Profit Tree for the newspaper print industry, which is shown below:

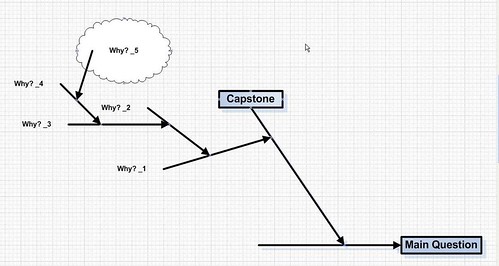
From the very little data we have, we know that Sunday circulation has dropped by 25%. Why? One effective way to arrive at the root causes as to why circulation has and is dropping is to conduct a root cause analysis, effectively communicated with an Ishikawa Diagram:

Once potential root causes are identified, it’s important that those potential root causes are tested. This will be our initial hypothesis, further refined and validated with testing — either statistical quantitative testing, or qualitative testing. Once root causes are identified and validated, Jack Welch might want to implement effort to eliminate or reduce the root cause for why circulation is dropping.
Next, Jack might want to stratify the Ad Rates by size or some other appropriate attribute. He might want to identify the 80/20 split to show that, perhaps, 80% of the revenue come from 20% of the ads, or some other attribute. He will want to do this also for the sales team. Processes like this almost always follow Pareto — that is, most likely 80% of the sales will come from 20% of the sales force (or some close approximation). This data can be best visualized with a Pareto Chart, an example of which is shown below:

Given this data from the Pareto Analysis, Jack might want to cut costs by laying off staff that aren’t producing. He might also want to eliminate ad sizes that are taking inventory space, but aren’t as profitable as other ad sizes. He might want to look at other media groups, such as The Boston Globe’s online properties. Perhaps he might want to push more ad sales toward that venue instead of print media, if it makes sense to do so.
Summary
Using a few simple but effective tools, we can drive toward the Root Causes for why Circulation is dropping and gain a better focus on which ad sizes makes sense to continue selling. Also, the same Pareto Analysis excercise on the sales force can give us an indication of sales force effectiveness and allow us to make decisions based on what and who is effective and who is producing.


No responses / comments so far.