All processes are subject to some variability. More common explanations of variability describes variability as either Common-Cause or Special-Cause. The former is easiest explained as expected variation within a process that is produced by the process itself. The latter, on the hand, is variation that is produced by the process by is assignable to some outside force. And this isn’t just theory either. There are very real applications where variation is a key, such as the Zipcar Penalty Fee issue.
From a Queueing Theory perspective, another way to think of variation is by stratifying variation based on predictable and unpredictable. But, before we go there, let’s revisit what Queueing is all about.
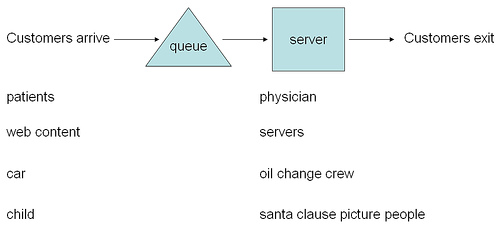
All processes involve inputs, a server, and outputs. This flow of events can be approximated with the picture below:

The picture above is simplified, but several points of variability can enter this simple system. For example, we take our kids to Picture People, a place we you can have your pictures takes (highly recommended for high quality pictures). We enter their system, wait, pictures are taken, then we leave. All business have either documented “busy times” and it’s by hunch — and the hunch is actually correct. This point is important.
Below is a Variability Tree, showing Predictable and Unpredictable Variability. This distinction is important because managing either type of variability will be different:

Most systems will show evidence of variability, as explained in the picture above; some will show both types, but typically one type will dominate.
For processes where arrivals are bursty or unpredictable, then the tools of Queueing Theory makes sense to apply; but for processes where the arrivals are predictable or seasonal, then it might make sense to apply the tools of Build-Up Diagrams.
How To Manage Variability
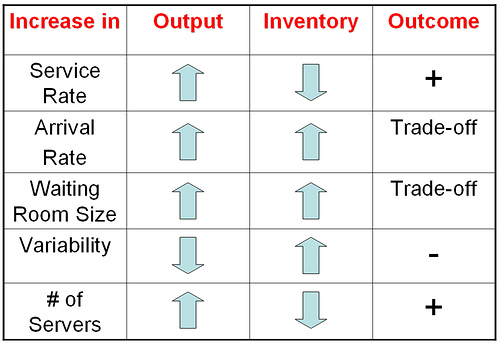
When reducing or eliminating variation is not the answer, then managing it is the next best thing to do. Below is a simple table that shows the impact of variability on a system. I built this diagram quickly, but you can modify this table for your particular process; I’ve made it general enough so that you can apply it to your particular situation:

I’m using the term Inventory in a generic way here ” it can mean people (patients) or actual things. For example, when the Waiting Room Size is bigger, then output can increase but there’s also an increase in the amount of patients in the room (patients = inventory). Use this trade-off table as it applies to your process.
It’s About the Customer
It’s important to always remember that it is Variation that people feel, not the average. Managing the variability in your process takes work and some knowledge of tools that are pragmatic and helpful. The average is an inadequate measure and is not descriptive of what the customer is feeling. If the customer is to benefit, we must take action against variation through reducing it or eliminating it and then managing it.


No responses / comments so far.