Most organizations collect and report on metrics that are not descriptive of their processes. Some of you may have noticed that most metrics that are reported are the “average” and some organization also use the “median”. Most people do not understand elementary statistics and their application to business. Here is the truth of the matter: Your customers do not feel the average – they feel the variation.
An inside-out view of the business is based on average or mean-based measures of our recent past. Customers don’t judge us on averages, they feel the variability in each transaction, each product we ship, each user interface we build, each online process we create, each interaction we have on the phone, each corresondence we have through email or a letter or a phone, and every other process that touches the customer in some way or form – online or offline.
Customers value consistent, predictable business processes that deliver world-class levels of quality. They feel the difference, not the average.
What is an Average? What is a Standard Deviation?
The first measure we would arrive at is the mean, or the average, which is described below:

The averages takes a series of discrete units and is divided by the sum count of all those units. This is the Mean or the Average.
To get the standard deviation, which is the measure of the average variation from the Mean or the Average, then, we would calculate the standard deviation like below:

Understanding the mean and the distribution from the mean is important — because our customer’s feel the variation, not the average.
A few examples
- For qualitative measures, such as”taste” or “texture” of a consumer good, we do not think in terms of an “average” taste. Instead, we as customers, think in terms of “oh, that tasted sweeter the last time I bought it” or “dish #2 from restaurant x tasted creamier this time than last.” We feel the difference, not the average. Yet, even qualitative measure rolled-up in company meetings report on the average or mean.
- For quantitative measures, we feel the variation, not the average. For example, (a) “The last time I ordered from Amazon, I received that package in 4 business days; but, on other times I receive my order usually after 6 days on standard shipping” or (b) “Yesterday when I went to Taco Bell during lunch hour, I was in and out of there within 10 minutes, but on other days I’m there for my whole lunch hour” or (c) “Since web x.0 company changed their user interface, it now takes me at least 3 more minutes to do what I used to do with the old user interface.”
These are some examples of quantitative measures. Yet, most likely, these types of metrics are reported as an average to upper management. Example (a) is a time-based measure, where an expectation was made from prior experience on deliver times; example (b) was also a time-based measure based on prior experience on server times; and example (c) is an example of a task-based usability test based on time, yet this metric will most likely be reported as an average such as ~80% of of our population that follow this path complete this task with an average time of 245 seconds. It is a problem when our measures do not reflect how our customers are really feeling. Here’s a real-world example:
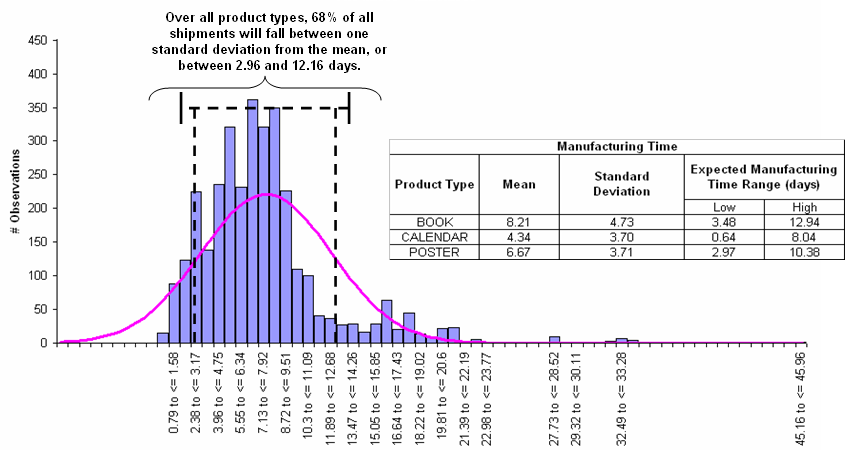
I was in charge of a click-to-ship process where the Marketing group made a customer promise that orders would be delivered within 10 business days. This is a great marketing tactic, but what did the data say about the current process capability?

The image above shows a data set that fits a normal distribution; the mean is calculated and so is the standard deviation. Given that the data fits the normal distribution, we can conclude that the data shows delivery times to be between ~3 and 12 days.
Why is this Important?
It’s important in several ways: (1), knowing this will help us better understand the customer experience – that is, when do they typically receive their stuff. The range of ~3 to 12 days is arguably a bad customer experience – there’s no smoothing effect here, but highly variable. The goal is to reduce variability so that the customer can have confidence in the company’s delivery estimates; (2) this empirical data can help the company pin-point where improvement opportunities might be; (3) this data might provide insight into product or lead to new product or shipment types.
*NOTE: The above is relevant in any process where there is a vendor-partner relationship or build-to-order process.
Basic Process Flow
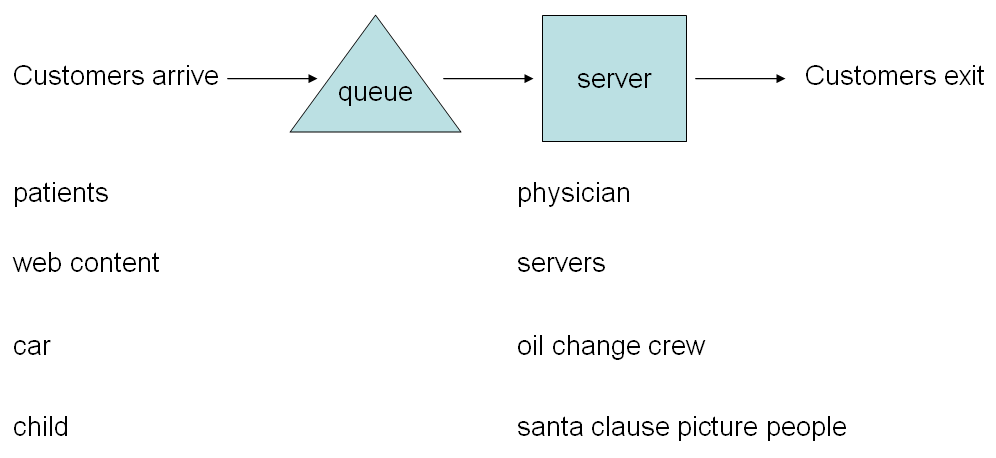
Let’s back-up a little bit. All processes involve inputs, a server, and outputs. This flow of events can be approximated with the picture below:

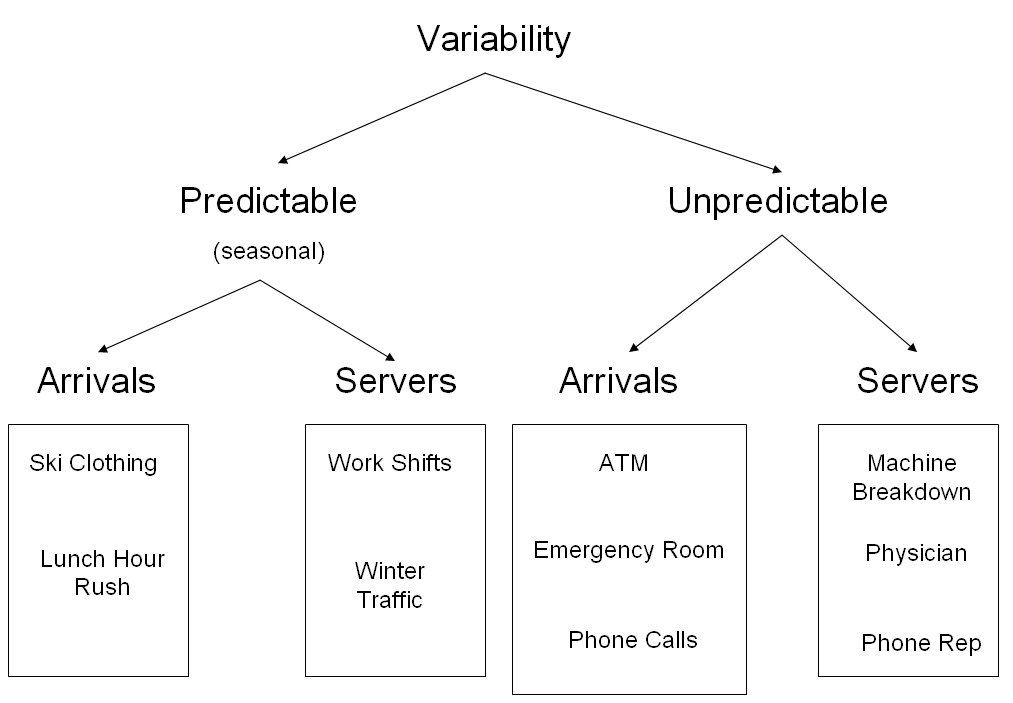
The picture above is simplified, but several points of variability can enter this simple system. Below is a Variability Tree, showing Predictable and Unpredictable Variability. This distinction is important because managing either type of variability will be different:

Most systems will show evidence of variability, as explained in the picture above; some will show both types, but typically one type will dominate.
For processes where arrivals are “bursty” or unpredictable, then the tools of Queueing Theory makes sense to apply; but for processes where the arrivals are predictable or seasonal, then it might make sense to apply the tools of Build-Up Diagrams.
How To Manage Variability
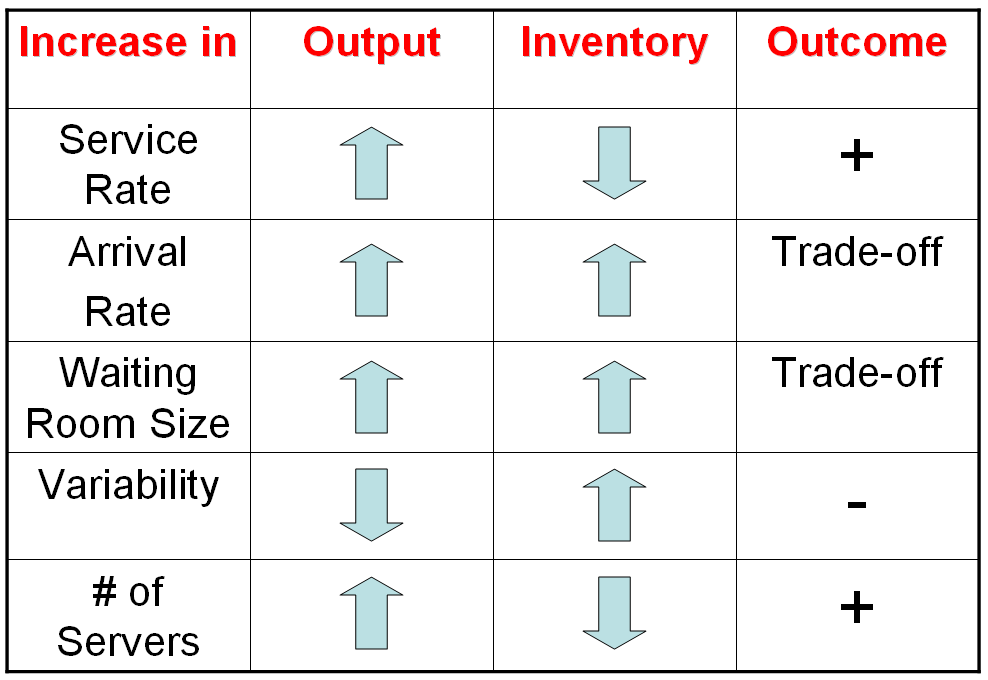
Below is a simple table that shows the impact of variability on a system. I built this quickly, but you can modify this table for your particular process; I’ve made it general enough so that you can apply it to your particular situation:

I’m using the term “Inventory” in a generic way here — it can mean people (patients) or actual things. For example, when the Waiting Room Size is bigger, then output can increase but there’s also an increase in the amount of patients in the room (patients = inventory). Use this trade-off table as it applies to your process.
It’s About the Customer
Again, Variability is what people feel, not the average. Managing the variability in your process takes work and some knowledge of tools that are pragmatic and helpful. The”average” is an inadequate measure and is not descriptive of what the customer is feeling. There are other measures that basic business statistics makes available to us that will help us (1) understand the customer better, (2) understand better where we can improve (3) identify ways in which we can further delight the customer.


Awesome! Thanks for a great post. You’ve nailed it – and I especially appreciate the way you’ve wrapped it up in your conclusion. It is about the customer. Well done.
“The image above shows a data set that fits a normal distribution” How on earth do you come to THAT conclusion? What is the Anderson-Darling statistic and the associated p value? It is obvious that the data does NOT fit the normal distribution. The data is heavily skewed. Just because the software overlays a normal curve on the histogram does NOT make the data normally distributed.
Yes, it sure looks right skew to me. You would expect a gamma distribution for waiting times. Using the normal will badly under estimate the chance of the customer waiting too long. Pity an otherwise interesting post was ruined by a sloppy example.
I have a question about the sentence “Your customers do not feel the average ” they feel the variation.” I have seen this quote shown as written by Tom Groark and was trying to track down which Tom Groark wrote it so I make sure to have the correct source as I have put it in a Six Sigma presentation. Did you write it or do you know which Tom did? Thank you.
Hi Suzanne,
I believe the original quote was from Proctor and Gamble’s CEO who said something along the lines of “Customers don’t feel the average, they remember the difference”. I put my little spin on it and used variation instead and omitted the word “remember”.
Thanks for taking the time to read.
Pete