This post is part of a series on Lean Manufacturing at Starbucks. Today, we’ll discuss Starbucks Waiting Time and Lean.
The series of posts can be found here:
- Starbucks, Why Lean, Why Now?
- Starbucks Lean Thinking, Turnaround, Alignment to Transformation Agenda
- Lean, Starbucks, Change Management and Resistance, Fiefdoms and Stores
- Starbucks Coffee, Queueing Theory, and Theory of Constraints
It seems that the majority of the effort in the Starbucks adoption of lean manufacturing principles is around increasing the quality of the coffee, more consistent taste outcomes, and on reducing the time it takes to make coffee and serve the customer.

Learn about Starbucks’ Lean journey in the book, Steady Work by Karen Gaudet
Putting the brand identity issues and customer experience aside, modeling the Starbucks queue isn’t difficult, but can be a bit complicated because of one major reason: Product Complexity.
According to one source, there are at least 87,000 to 168,000 drink combinations available at Starbucks. Now, if you’re into the combinatorial mathematics, this might be an interesting theoretical problem, but from the perspective of a customer and real life, that many options is neither good for business nor good for the customer.
While the actual number of product offerings isn’t that large, the ability for a customer to combine them creates massive unnecessary complexity and increases the service time.
Material Flow and Information Flow
Lean, as applied to Starbucks, can take two approaches:
- Follow the product.
- Follow the customer.
In reality, it’s most likely both. But, following the product with that many combinations is not prudent. But, following the customer is more likely and, in the case of service operations, more appropriate.
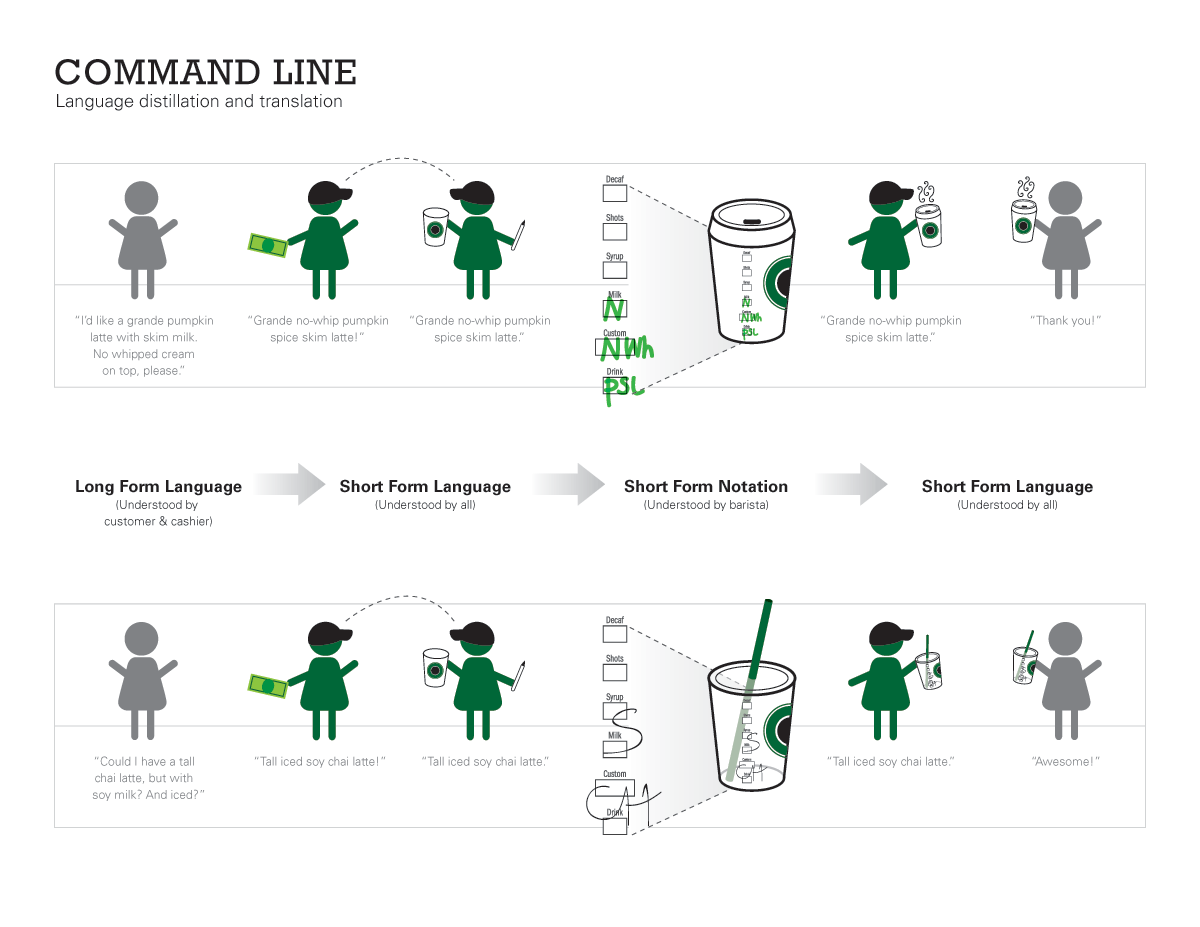
Consider the illustration below (source: http://www.pixelkated.com/):

The illustration above shows an example of a few drink combinations and the various ways those combinations can be communicated by the customer, understood by the Barista, and communicated back to the customer from the Barista: long form, short form, and various other combinations.
Businesses can cut costs by heeding the lean work force principles outlined in Kronos’ latest white paper. By implementing these practices, manufacturers have improved everything from operations to productivity to resource utilization.
Service versus Manufacturing
This marks the distinct difference between service and manufacturing: In service, the customer plays a direct contribution to the making of the product. In manufacturing, the customer is simply the recipient of the product.
Moreover, not only is there statistical variation in the time to complete a drink (mean and standard deviation), but there is also massive variety as the illustration shows.
Variation does not equal Variety.
Modeling the Starbucks Queue
I’m not going to pretend to know what the Starbucks queue properties are – I don’t drink coffee and have visited a Starbucks for Apple Cider an astounding 4 times, but I can guess that, like most queues in restaurant operations, customers arrive based on an M/M/1 distribution, or can be described by a Poisson model with heavy periods in the morning, around lunch, and perhaps through dinner time. Here are the assumptions of a M/M/1 distribution:
- M/M/1: Random Arrival, Random Service, One Service Channel (one cashier)
- The number of customers in the system is very large.
- Impact of a single customer on the performance of the system is very small, i.e. a single customer consumes a very small percentage of the system resources.
- All customers are independent, i.e. their decision to use the system are independent of other users.
Looking at the queueing assumptions for the M/M/1 distribution, I can see how (1) and (3) could be true. But, I don’t believe assumption (2) holds: service time is random, especially given the complexity of product combinations at Starbucks (Incidentally, making service time more consistent is part of the Starbucks lean effort – to make service time more predictable). Moreover, the impact of a single customer could be very large, especially if that customer’s order was mistakenly made and Starbucks had to fix the order – that type of rework adds undue burden to the system.
But we’ll play along, knowing that this is the closest approximation we have to modeling a restaurant operation queue.
Let’s define the following:
- λ (lambda) = Arrival Rate, or more specific, the time between arrivals. For most queues, we can assume that the arrival distribution can be approximated by a Poisson distribution; which means that the time between arrivals are not deterministic, but random.
- μ (mu) = Service Rate, or more specific the time for a arrival to be serviced.
- ρ (rho) = λ / μ
- C = Number of Service Channels
- M = Random Arrival/Service rate (Poisson)
- D = Deterministic Service Rate (Constant rate)
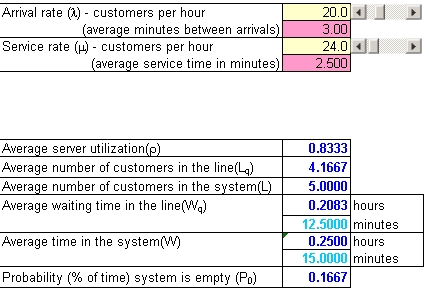
Let’s assume an average Starbucks location gets 240 Customers on a 10 hour day (μ = 24 customers per hour) and the time to serve a customer is 3 minutes (λ = 60 minutes per hour / 3 minutes between customers = 20 customers on average per hour). Average service time would be 60 minutes per hour / 24 customers per hour (μ) = 2.5 minutes on average per service required.
Given the above, we get:
- The probability of having zero customers in the system: Po = 1 – ρ
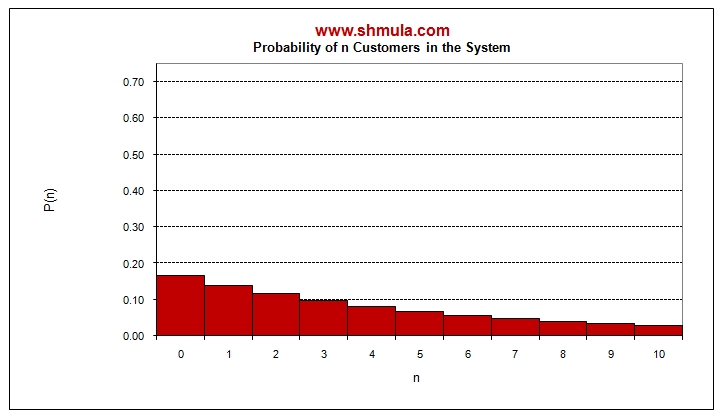
- The probability of having n customers in the system (where n is greater than zero): Pn = (ρ^n) * Po
- Expected average queue length: E(m) = ρ / (1 – ρ)
- Expected average total time: E(v) = ρ / (λ (1 – ρ))
- Expected average waiting time: E(w) = E(v) – 1/μ

The calculations above are as follows:
- λ = 20
- μ = 24
- Average server utilization (ρ) = λ / μ = 20 / 24 = 0.8333
- Expected average queue length = E(m) = Average number of customers in the system (L) = = ρ / (1 – ρ) = 0.8333 / 0.1667 = 5
- Expected average total time: E(v) = ρ / (λ (1 – ρ)) = 0.833 / (20*(1-0.833)) = 0.833 / (20*0.1667) = 0.833 / 3.334 = 0.25
- Expected average waiting time (Wq or E(w)) = E(v) – 1/μ = 0.25 – (1/24) = 0.2083
- The probability of having zero customers in the system: Po = 1 – ρ = 1 – 0.833 = 0.1667 or 16.67%

In the chart above, to calculate the probability of 5 customers in line = P(5) = (ρ^n) * Po = 0.8333^5 * 0.1667 = 0.402 * 0.1667 = 0.067 or 6.7%
Okay, the results above are theoretical and not really accurate because the quick model I created in the span of 3 minutes doesn’t take into account peak periods, but it gives you and idea of what is possible. Without context, the results above are really useless, but an interesting exercise nonetheless.
Here’s the upshot for how to make queueing models helpful for Starbucks (or most restaurant operations):
- The factor for which Starbucks has the most control is the service time – in general, reducing service time allows for more predictable queueing distribution.
Advice for Starbucks
If establishing a consistent order fulfillment drumbeat is important, Starbucks needs to do the following:
- Reduce, immediately, the number of product combinations.
- Model the properties of each of those combinations in both time, material, information, steps, and flow. But, focus on the 80/20 – the most ordered combinations first.
- Identify the natural bottlenecks, then apply the principles of lean to the bottlenecks first. Some knowledge of the Theory of Constraints will be helpful, but it’s also common sense to identify where the known bottlenecks are in a dynamic system such as Starbucks.
- Service Time is really the only controllable factor Starbucks has, so focus on that, but keeping in mind always the customer experience.
- Reduce Service Time AND improve product quality – the impact of rework loops will make the queue achieve WIP Explosion.
For the Starbucks Lean Transformation to have the desired outcome I think the executive management wants, they need to really think of the constraints in their system and target the application of lean principles there first. This approach, coupled with my previous advice of allowing the Baristas to learn, stretch, and grow in lean leadership will likely lead to the outcomes Starbucks desires.
A lean enterprise is a business system to organize and manage product development, operations, suppliers, and customer relations. Companies use lean principles to do business more efficiently and with less space, capital, and time than conventional mass production. Work force is critical to the success of a lean business. Manufacturers can identify non-value-added labor, measure and manage variability, and motivate workers to ensure labor is most efficient. Kronos’ report offers additional advice for implementing these practices.


Pete, An elegant analysis and one that I think is perfect for McDonalds.
You were consistently clear on the assumptions in the model and warned early on that you were putting “brand identity issues and customer experience aside” but we must still revisit them when we get to the recommendations.
For Starbucks, following the first of the recommended steps needed to “establishing a consistent order fulfillment drumbeat” would be a mistake as it would seriously undermine its brand position. And I say this as a coffee drinking TOC guy who loves to see DBR at work.
Starbucks, like the local espresso stand, promises and is expected to deliver a high mix, user customized product. They made a choice to standardize not the product mix but their quality and service levels. Verifiable evidence of these choices include the high profile replacement of automatic espresso machines with older designs that allow more operator control as well as the elimination of the practice of staging shots for near future use.
Starbucks balanced these choices against optimizing takt, relying on their customer’s willingness to wait (both to order and to accept delivery) in return for receiving their exact drink of choice within a higher and reliable quality and service range. Starbucks knows they have an internal constraint, but usually only at peak demand, and it’s one they’re ok with as long as their customers are ok with it too.
Instead of Lean I think Starbucks is using a perturbation on an S-DBR approach.
Starbucks can also dual screens so customers can examine the accuracy of the order. Maybe go so far as to show a visual representation of the ordered drink.
Baristas also walk over empty cups to the drink maker. Seems like a walking waste. I wonder if remote printers could be used instead.
I agree with Michael Clingan. Reducing the variety of options is going to erode the service that Starbucks offers. In my mind, reducing product offerings is not the right solution. The right solution is to find a way to offer products that the customer wants.
One thing that Starbucks _has_ done is put a lot of thought into the flow of work behind the counter. When there are busy periods, staff go into more specialized functions; drinks cups aren’t walked from one location to another; the barista only does hot drinks; another does cold and brewed; etc., etc. They have already managed a lot of the variation induced by the variety by having the specific variety options (flavors; milks; sugars) in close proximity, so the combinatorial problem isn’t as bad: flavor / not flavor instead of which of 15 flavors. They have also managed a lot of variability in quality by installing more automated espresso machines that take out more of the “art” of making the espresso and steaming the milk.
Looking at other coffee shops with different perspectives on what they offer. High end coffee shops are SLOW because they put care and attention into each cup. They still have specialized positions, but they aren’t anywhere close to “production line” like Starbucks or Petes. Customers are willing to wait for what they believe is a better quality product.